
Coding & Development✨gemini🤖claude🌐universal
bdg - Browser Debugger CLI
Let Claude Code and other coding agents drive and debug Chrome from the shell. DOM, network, console and raw CDP as short commands, no screenshots and no MCP needed.
Quick Start
Install this Skill
npx skills add szymdzum/browser-debugger-cli# bdg - Browser Debugger CLI
[](https://www.npmjs.com/package/browser-debugger-cli)
[](https://github.com/szymdzum/browser-debugger-cli/actions/workflows/ci.yml)
[](https://github.com/szymdzum/browser-debugger-cli/actions/workflows/security.yml)
[](https://github.com/szymdzum/browser-debugger-cli/pulls)
**Give your AI agent a real browser. And the DevTools to go with it.**
📖 **[Wiki](https://github.com/szymdzum/browser-debugger-cli/wiki)**: [Getting Started](https://github.com/szymdzum/browser-debugger-cli/wiki/Getting-Started) · [Commands](https://github.com/szymdzum/browser-debugger-cli/wiki/Commands) · [For AI Agents](https://github.com/szymdzum/browser-debugger-cli/wiki/For-AI-Agents) · [Recipes](https://github.com/szymdzum/browser-debugger-cli/wiki/Recipes) · [Quick Reference](https://github.com/szymdzum/browser-debugger-cli/wiki/Quick-Reference) · [Troubleshooting](https://github.com/szymdzum/browser-debugger-cli/wiki/Troubleshooting) · [CLI reference](docs/CLI_REFERENCE.md)
bdg keeps a browser session open in the background and lets you drive it one shell command at a time. Click, fill, navigate, then read what actually happened: requests, console errors, layout and styles. It is built for coding agents like Claude Code, Codex and Gemini CLI, and it's just as handy in your own terminal. Every command is a plain process with compact output, so it pipes into `jq` and costs an agent few tokens.
```bash
npm install -g browser-debugger-cli
bdg localhost:3000
```
## Two ways to use it
### Debug a page: browser telemetry on demand
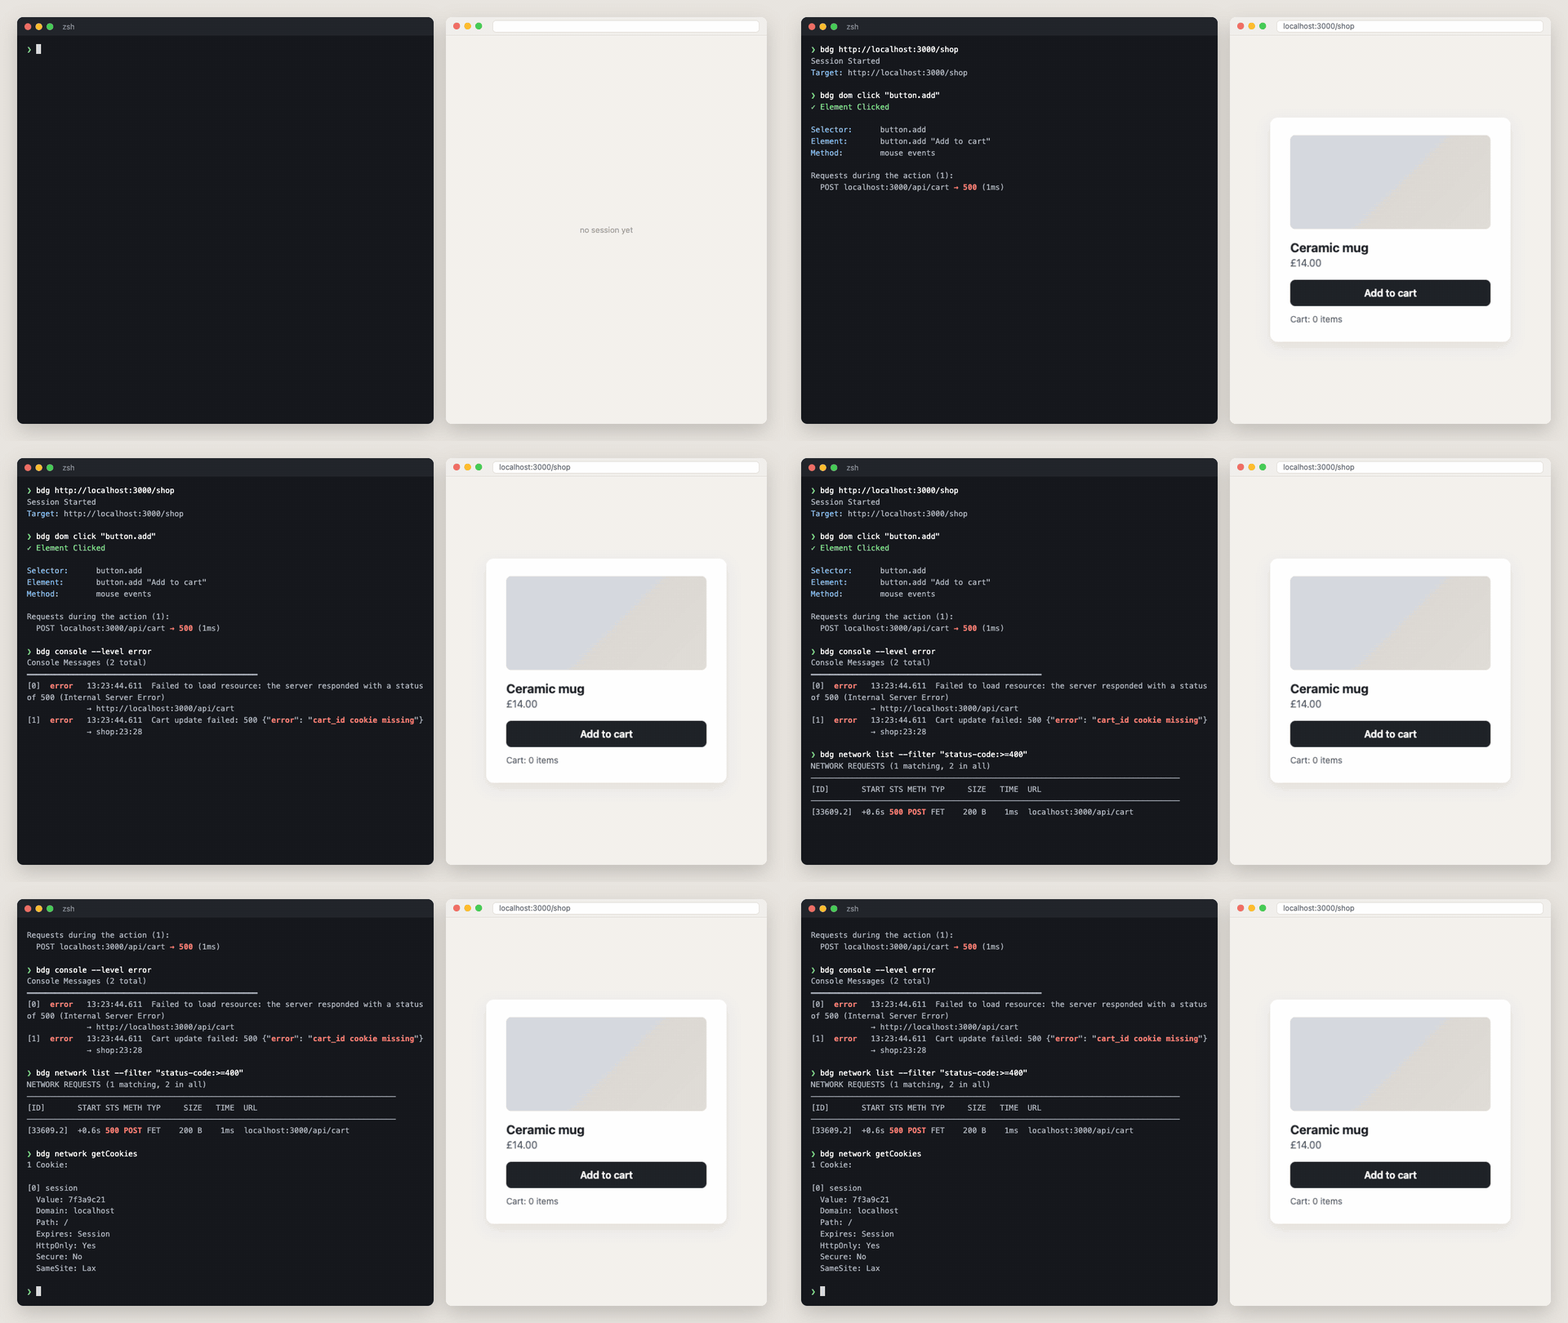
The cart button does nothing, and the page doesn't say why. Three commands later the agent knows: the click fired a POST that returned 500, the console says the `cart_id` cookie is missing, and the cookie jar confirms it. Network, console, cookies and the DOM are there whenever the agent asks, without a debugger UI.
### Automate without writing a script
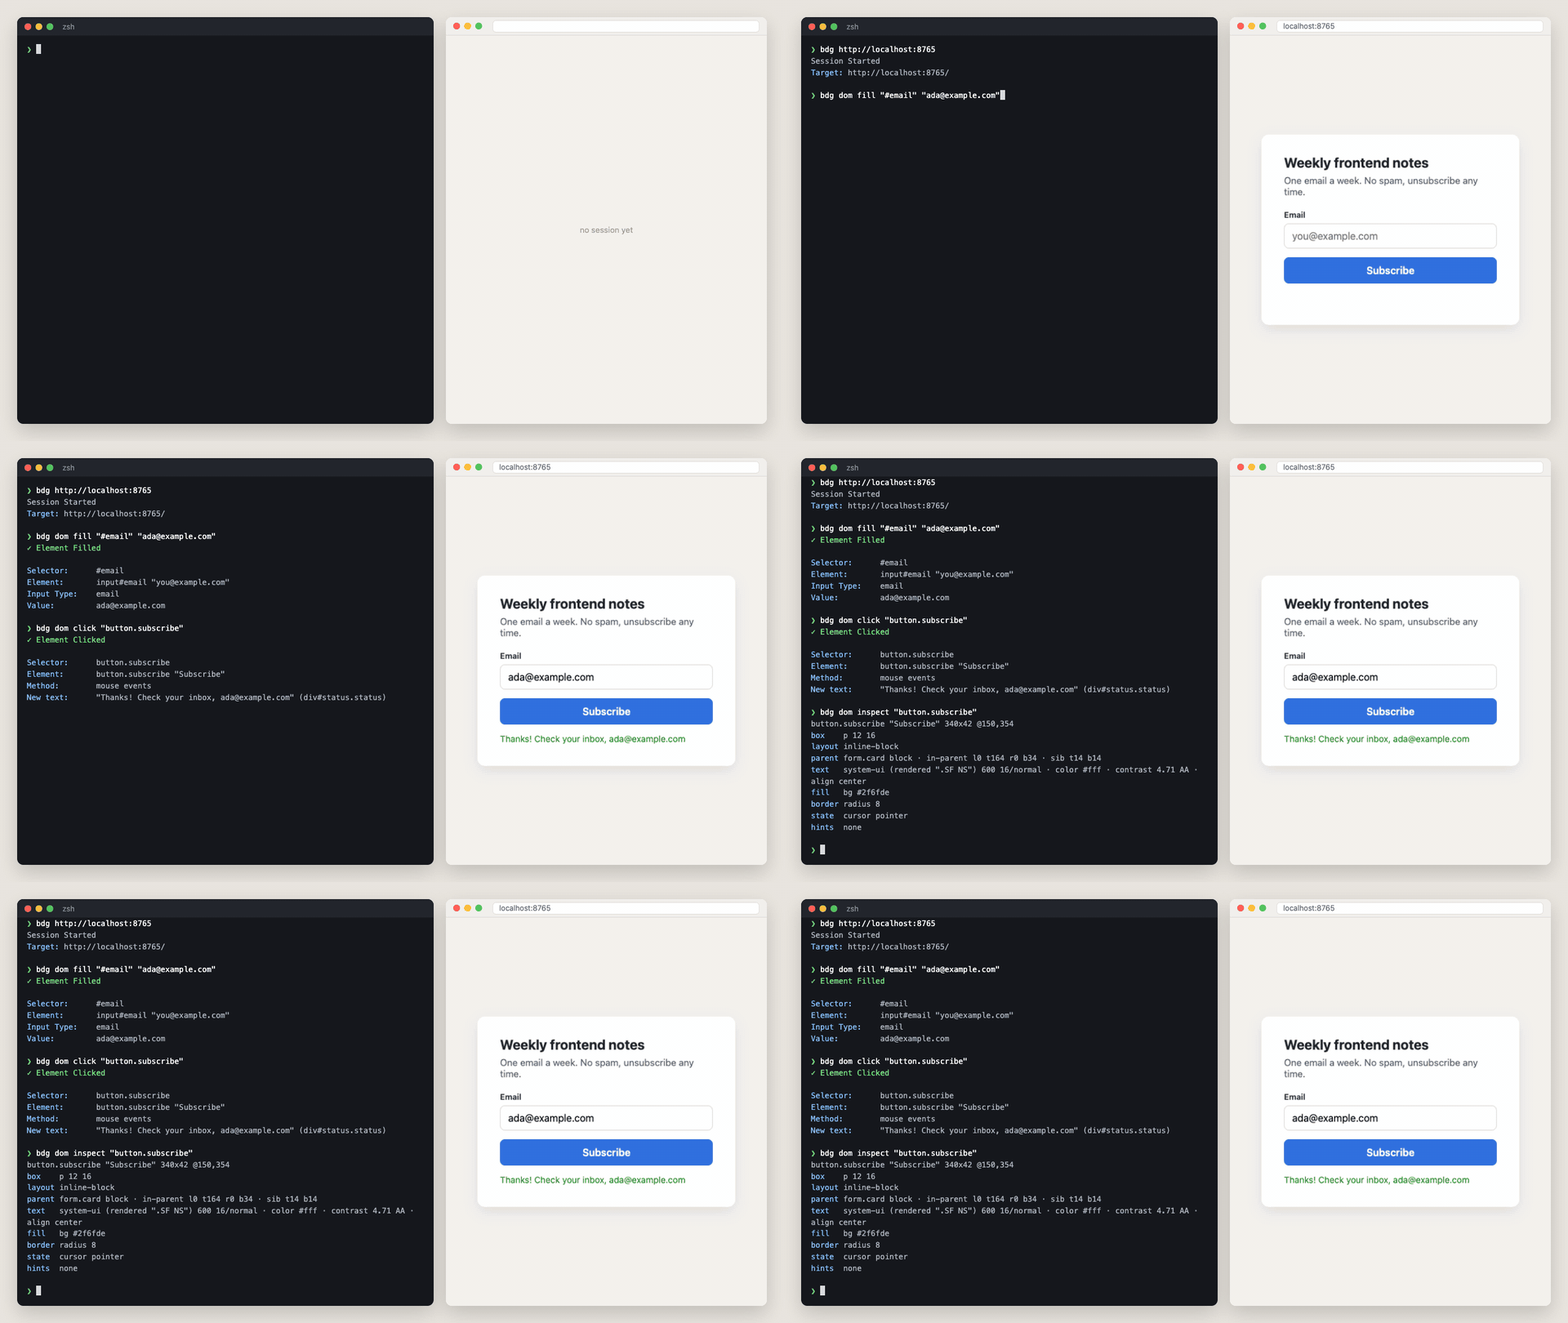
No Playwright script written up front. The agent runs one command, reads what the browser reports back, and picks the next step from that: the click says which text appeared, `dom inspect` says what the button looks like. When the page does something unexpected, the agent adapts on the spot instead of failing at line 40 of a test.
## More examples
### Reuse the browser's login from the shell
```console
$ bdg network getCookies
[1] session_id
Value: s%3A9f8e7d6c
HttpOnly: Yes
SameSite: Lax
$ bdg network headers 89565.2 --header authorization
Request Headers:
Authorization: Bearer eyJhbGciOiJIUzI1NiJ9.eyJzdWIiOiJhZGEifQ.demo
$ bdg eval "localStorage.getItem('access_token')"
eyJhbGciOiJIUzI1NiJ9.eyJzdWIiOiJhZGEifQ.demo
```
`HttpOnly` cookies are included, even though the page's own JavaScript can't read them. Log in once in the browser, then reuse the session from the shell:
```bash
COOKIES=$(bdg network getCookies --json | jq -r '[.data[] | "\(.name)=\(.value)"] | join("; ")')
curl -H "Cookie: $COOKIES" localhost:3000/api/me
```
### The rest of DevTools
```console
$ bdg dom a11y tree
[RootWebArea] "My App" (focused)
[Heading] "My App"
[Button] "Sign in" (focusable)
[Image] ← no accessible name
$ bdg cdp Performance.enable
$ bdg cdp Performance.getMetrics --json | jq '.data.result.metrics | from_entries'
{ "Nodes": 51, "LayoutDuration": 0.000115, "ScriptDuration": 0.000775, "JSHeapUsedSize": 772124, ... }
$ bdg cdp Emulation.setCPUThrottlingRate --params '{"rate":4}' # Slow CPU
$ bdg cdp Network.emulateNetworkConditions --params '{"offline":false,"latency":400,"downloadThroughput":50000,"uploadThroughput":20000}'
```
Accessibility, performance metrics, CPU profiling, heap snapshots, code coverage, throttling, storage, service workers: everything Chrome DevTools can do, bdg can do too, through raw CDP. Can't find the method you need? `bdg cdp --search heap`.
## Agents learn it on their own
No docs to paste into the prompt. The agent asks bdg:
```bash
bdg --help --json # Every command, flag and exit code, plus "task → command" mappings
bdg dom query --help --json # One command in full: option behaviors, defaults, examples
bdg cdp --search cookie # 13 matching methods across al
... (truncated)Repository
175stars
10forks
Details
Related Skills
More coding & development skills you might like
Reticle
Coding & DevelopmentAI agents can generate code, but still struggle to understand what they build. Reticle brings Jev-style machine-native runtime perception to web & desktop applications.
🤖claude🌐universal
1.2k
190
View
agentscope-java
Coding & DevelopmentExpert Java developer skill for AgentScope Java framework - a reactive, message-driven multi-agent system built on Project Reactor. Use when working with reactive programming, LLM integration, agent orchestration, multi-agent systems, or when the user mentions AgentScope, ReActAgent, Mono/Flux, Project Reactor, or Java agent development. Specializes in non-blocking code, tool integration, hooks, pipelines, and production-ready agent applications.
🌐universal
6.0k
1.5k
View
ospec
Coding & DevelopmentDocument-driven OSpec workflow for initialization, change/goal routing, validation, archiving, and durable project knowledge.
✨gemini🤖claude💬gpt🌐universal
524
34
View
misakanet-failure-memory
Coding & Development📚 A zero-dependency, git-backed micro-lesson library for AI Agents to asynchronously share and search verified debugging experience. Python stdlib only. | https://misakanet.org
🤖claude⌨️cursor🌐universal
424
158
View